

What you’ll set up
- Agent running on Kubernetes with health checks
- Redis for session storage (bundled in the chart)
- Prometheus metrics scraping
- Grafana dashboard with live panels (sessions, latency, tokens)
Prerequisites
You’ll also need API keys for the AI services:
Step 1: Get the example
Clone the repository and navigate to the deploy example:Step 2: Create your .env file
.env and fill in your API keys.
Step 3: Build the Docker image
Generate the lock file and build:Step 4: Build Helm dependencies
The chart includes Redis as an optional bundled dependency:Step 5: Install
We disable
metrics and grafana for now because they require Prometheus CRDs (ServiceMonitor). We’ll enable them in Step 8.- Agent — Deployment with health probes, resource limits, and your API keys
- Redis — Standalone instance for session storage
- Service — ClusterIP for internal routing
- Ingress — External access (disabled by default, enable with
ingress.enabled=trueand setingress.host)
Step 6: Verify
Wait for pods to be ready:1/1 Running:
The agent pod may restart once on first deploy. This happens because the agent tries to connect to Redis at startup, but Redis isn’t ready yet. After the restart, Redis is up and everything works normally.
Test the health endpoint
HTTP 200
Create a session
Step 7: Verify Redis
Check that the session was stored in Redis:Step 8: Monitoring (Prometheus + Grafana)
Install the monitoring stack
This installs Prometheus + Grafana with CRDs for ServiceMonitor:Enable metrics in the agent chart
Now upgrade with metrics and Grafana dashboard enabled:metrics.additionalLabels.release=monitoring is required so Prometheus discovers the ServiceMonitor. The label must match your Prometheus serviceMonitorSelector — for kube-prometheus-stack, it’s release: <release-name>.- ServiceMonitor — tells Prometheus to scrape
/metricson the agent pods - Grafana Dashboard — auto-provisioned via ConfigMap sidecar
Open Grafana
If you see
pod is not running. Current status=Pending, wait a moment for the Grafana pod to start and retry. The monitoring stack takes a bit longer to initialize than the agent.admin / admin.
Grafana login screen
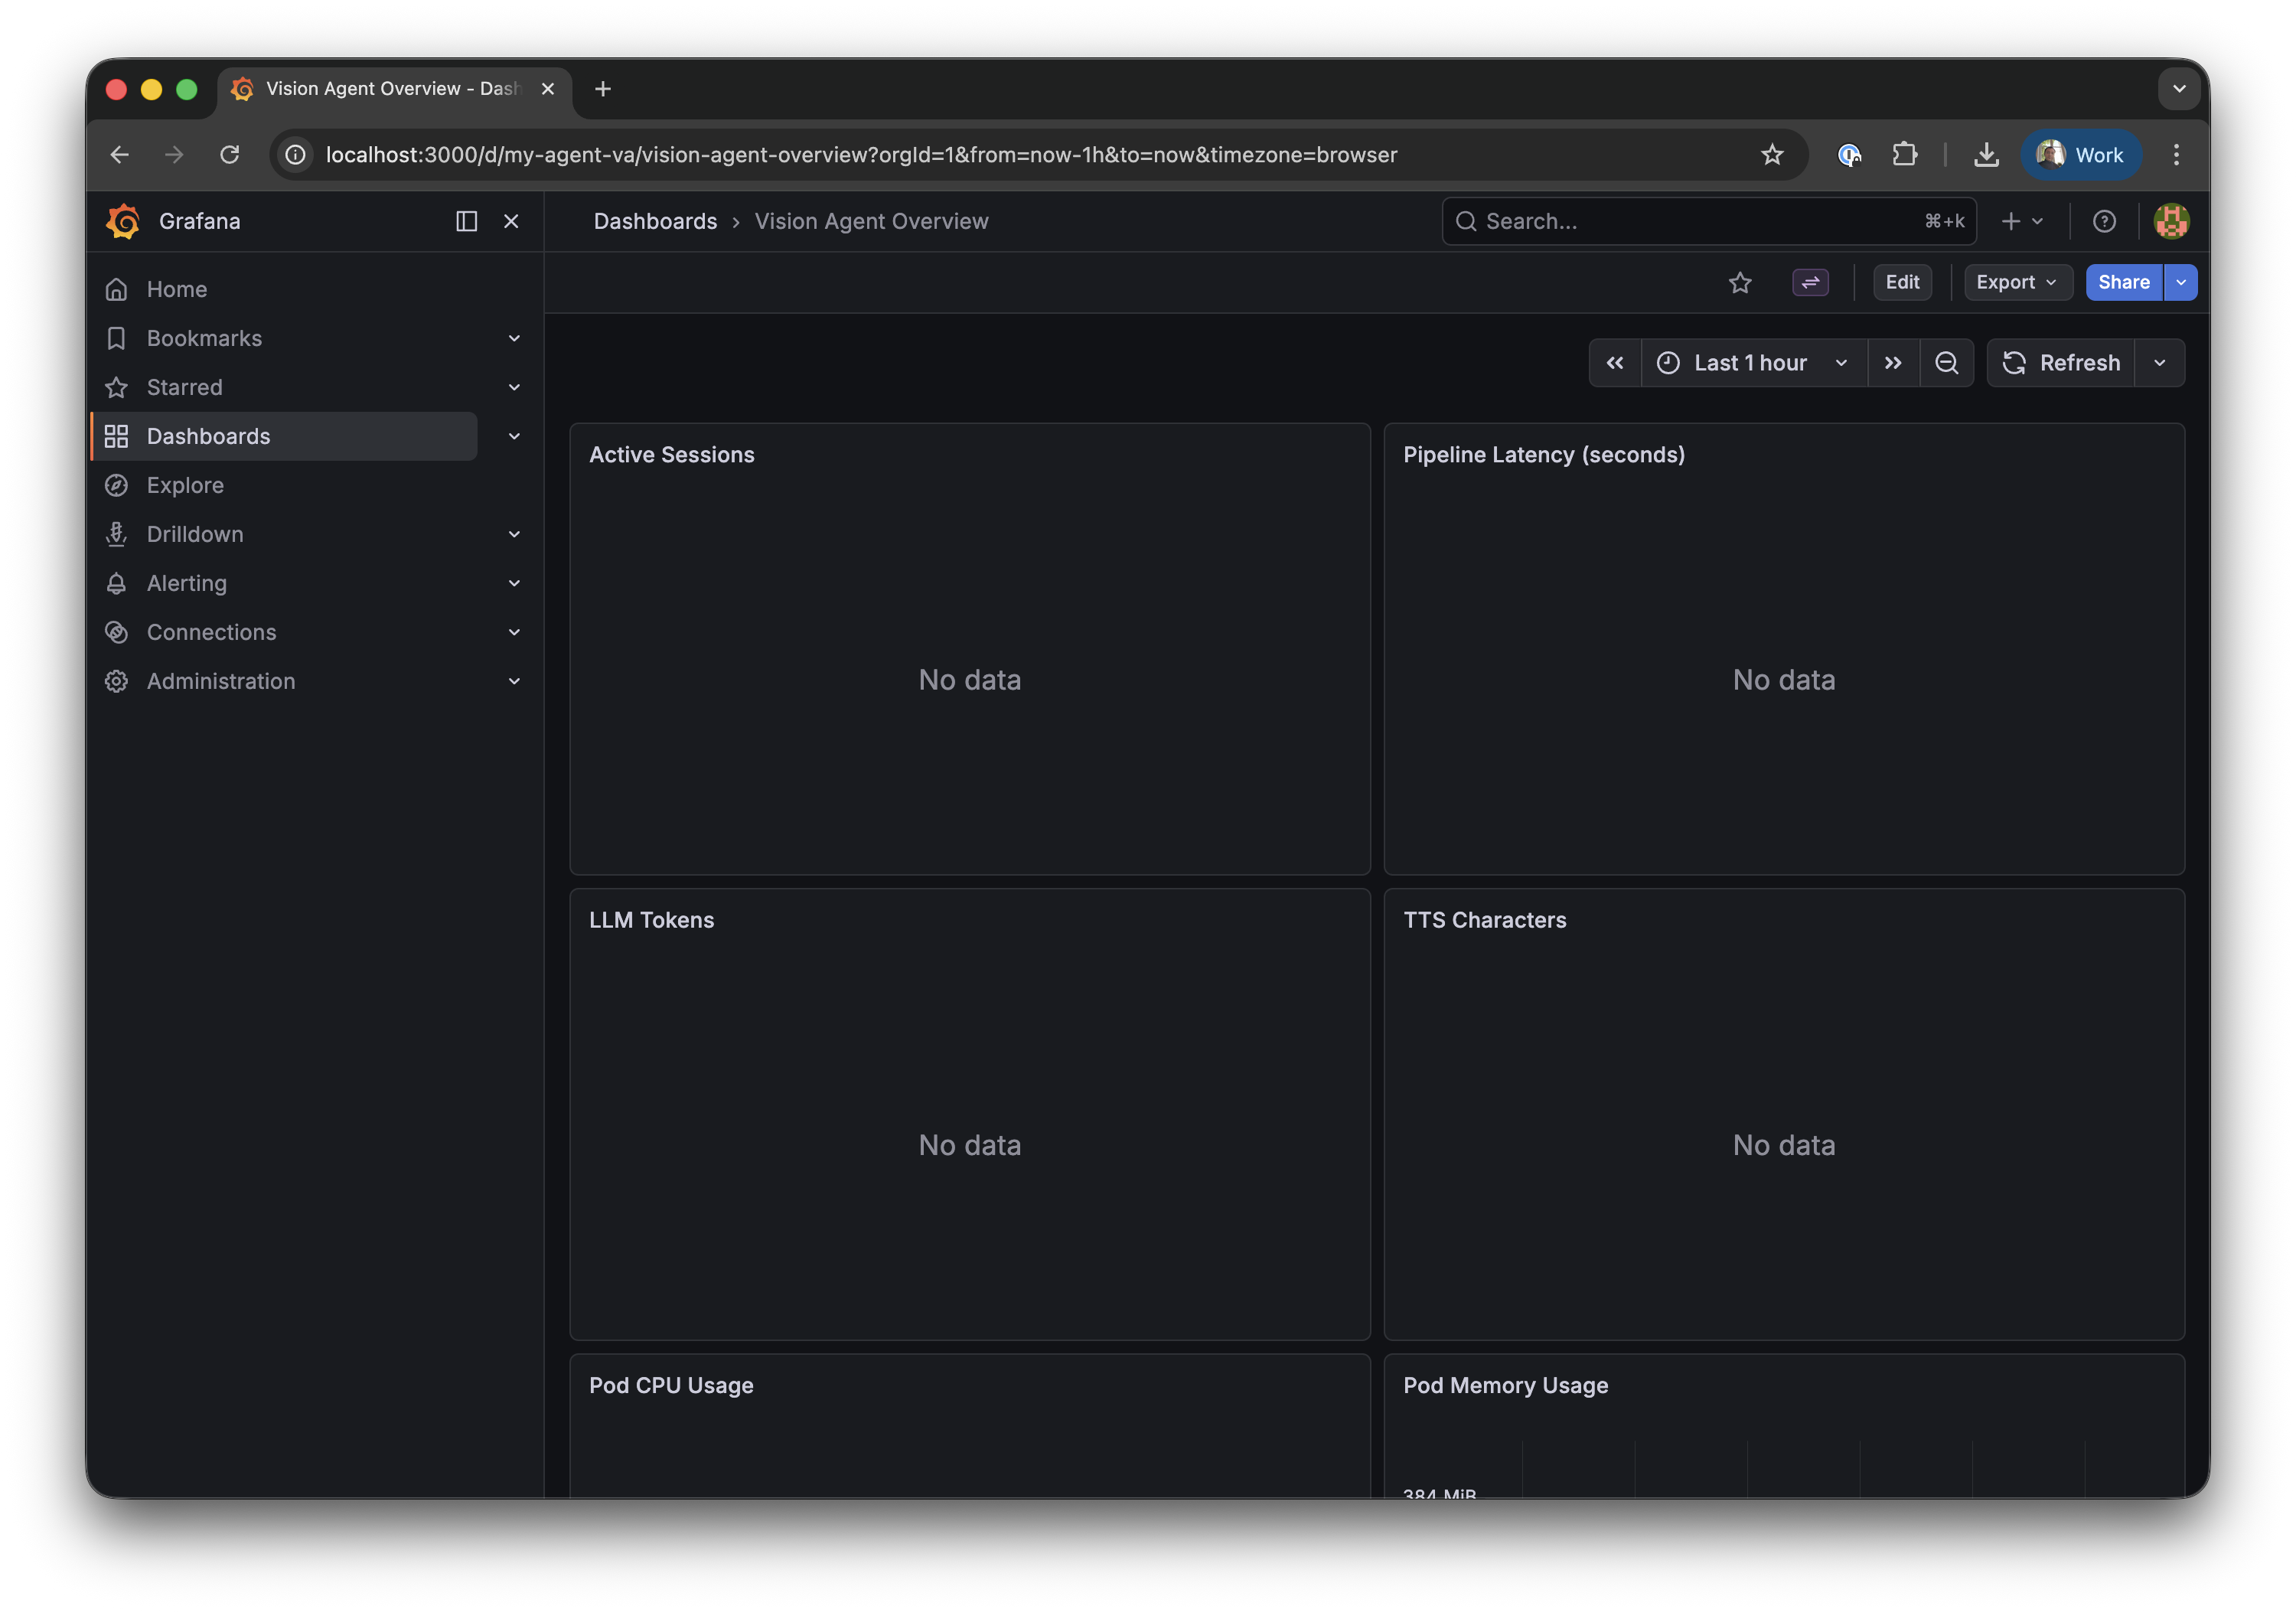
Vision Agent Overview dashboard in Grafana
Generate some data
Create test sessions to verify the metrics pipeline works end-to-end. The 3-second delay between sessions ensures Prometheus captures active session counts between its 30-second scrape intervals:For sustained, non-zero application metrics, connect a real client via the Stream Video SDK. Test sessions created via curl are short-lived and may complete between Prometheus scrape intervals (30s).
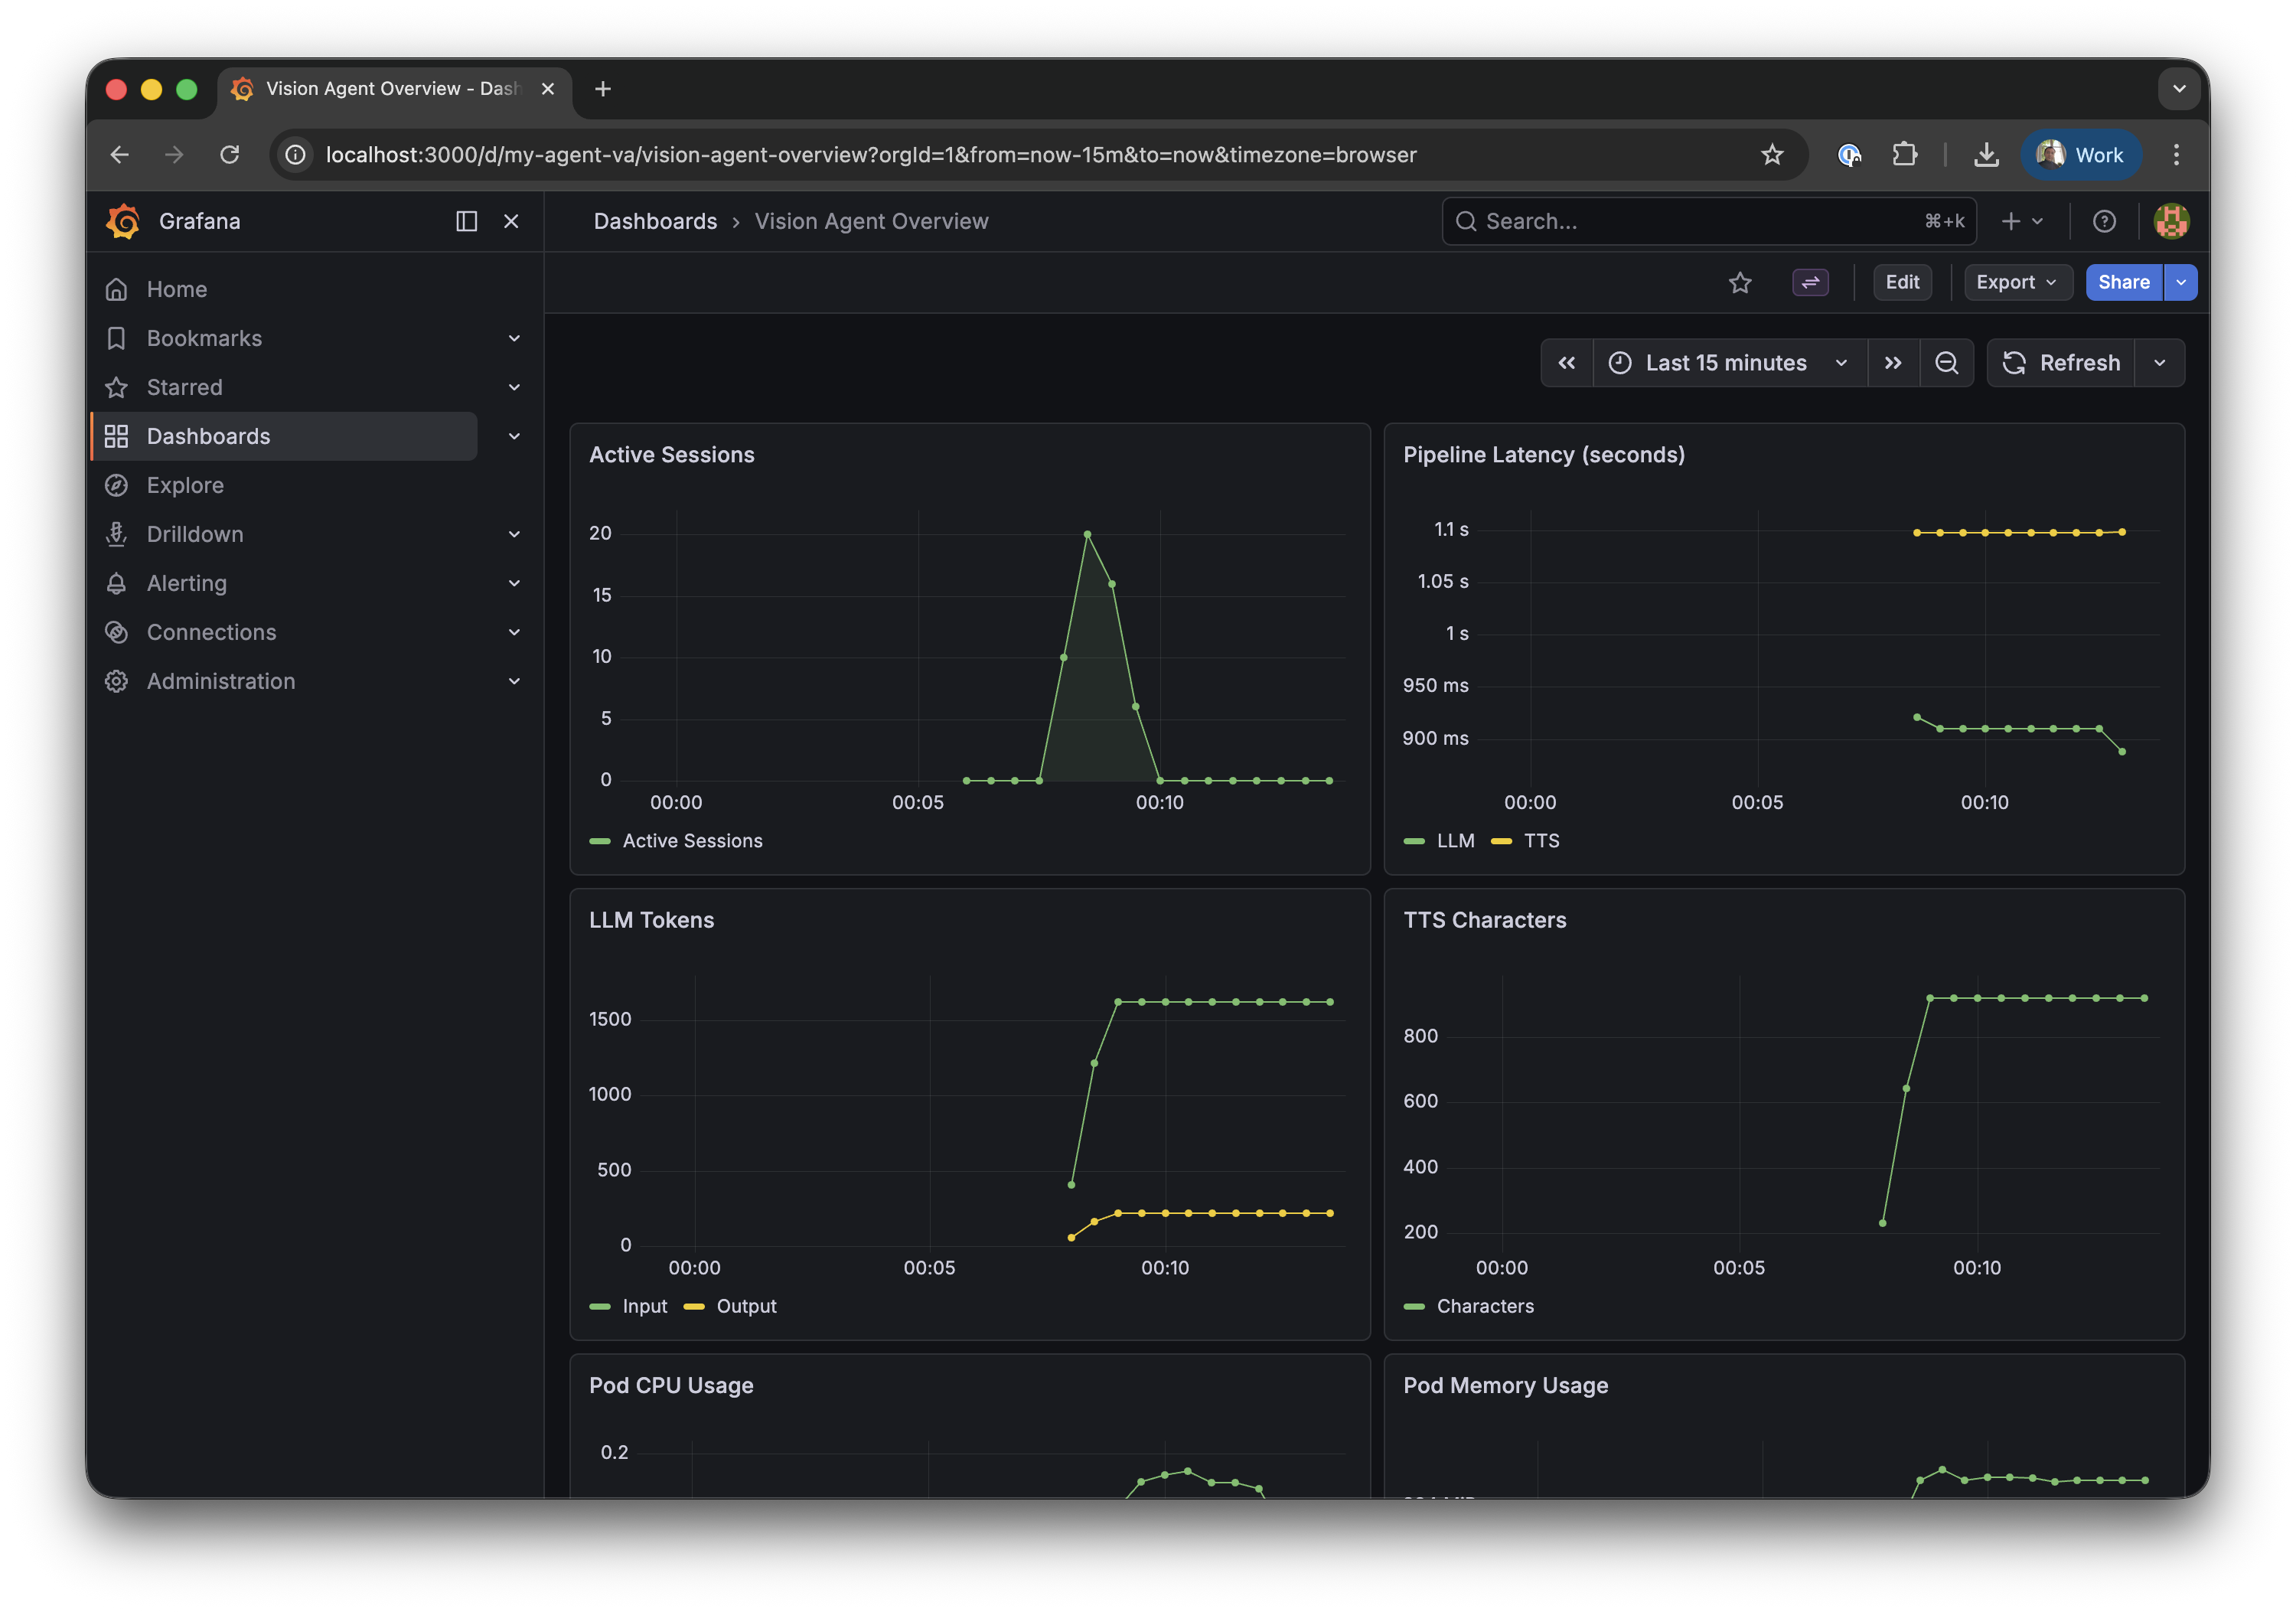
Vision Agent Overview dashboard after running test sessions
Configuration reference
values.yaml — key settings
Using managed Redis (production)
For production, use a managed Redis service instead of the bundled one:Using a custom domain
Troubleshooting
Pod crashes immediately — uv.lock not found
You need to generate the lock file before building:
Server listens on 127.0.0.1 — probes fail
The Dockerfile must use --host 0.0.0.0:
--host 0.0.0.0, the server only accepts connections from inside the container, and Kubernetes health probes can’t reach it.
ServiceMonitor exists but Prometheus doesn’t scrape
Prometheus only watches ServiceMonitors with matching labels. Check what your Prometheus expects:Grafana dashboard shows “No data”
- Check Prometheus is scraping: open http://localhost:9090/targets (port-forward Prometheus first)
- Check the metric exists: in Grafana Explore, query
ai_demo_active_sessions - If data shows in Explore but not the dashboard — restart Grafana to reload ConfigMaps:
Cleanup
Remove everything:Next steps
HTTP Server
API endpoints, session limits, and CORS configuration
Horizontal Scaling
Multi-replica deployment with Redis session registry
Telemetry & Metrics
OpenTelemetry metrics reference and Prometheus queries
Docker Deployment
Docker, GPU, and general deployment tips